
When analyzing global macroeconomics, crude oil remains the most critical and volatile variable. In particular, geopolitical tensions in the Middle East or disruptions in major maritime routes immediately translate into global inflationary pressures.
However, you do not need to track every sensational news headline. To cut through the market noise and identify fundamental risks in the supply chain, here are the three core macroeconomic indicators that “smart money” (institutional investors) intuitively monitor.
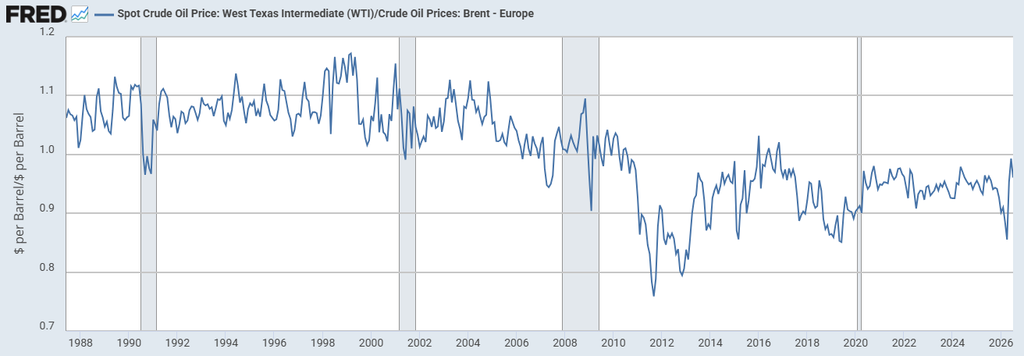
1. The Brent-WTI Spread Monitor the price difference between Brent crude and West Texas Intermediate (WTI), the two pillars of global oil prices. Because Brent serves as the benchmark for the global seaborne oil market, it immediately reflects geopolitical risk premiums in Europe or the Middle East. WTI, on the other hand, is more sensitive to domestic supply and demand dynamics within the United States. If this spread widens sharply beyond historical norms, it serves as a powerful leading indicator of severe bottlenecks somewhere in the global supply chain.
🔍 Case Study: Consider the immediate aftermath of Russia’s invasion of Ukraine in 2022. As fears of a paralyzed global seaborne oil supply chain gripped the market, Brent crude prices skyrocketed, and the spread with WTI rapidly expanded to over $10 per barrel—three to four times the usual level. This widening spread was not merely a price hike; it was the earliest and most definitive warning sign of an impending energy crisis in Europe and Asia.
2. Baltic Dirty Tanker Index (BDTI) When geopolitical friction occurs at major maritime chokepoints, such as the Strait of Hormuz or the Red Sea, oil tankers are forced to take detours spanning thousands of kilometers for safety. This triggers an immediate surge in freight rates. If the BDTI (Baltic Dirty Tanker Index) shows a spiking trend, it is a strong indication that massive logistical costs will soon be passed on to physical oil prices.
🔍 Case Study: A prime example is the recent movement of the BDTI during the Red Sea Crisis triggered by Houthi rebel attacks. As the number of oil tankers bypassing the Suez Canal to detour around the Cape of Good Hope surged, the freight index skyrocketed vertically in just a few weeks. Even before inflation figures hit the real economy, this provided vivid, leading data showing that massive cost increases were already underway in the logistics sector.
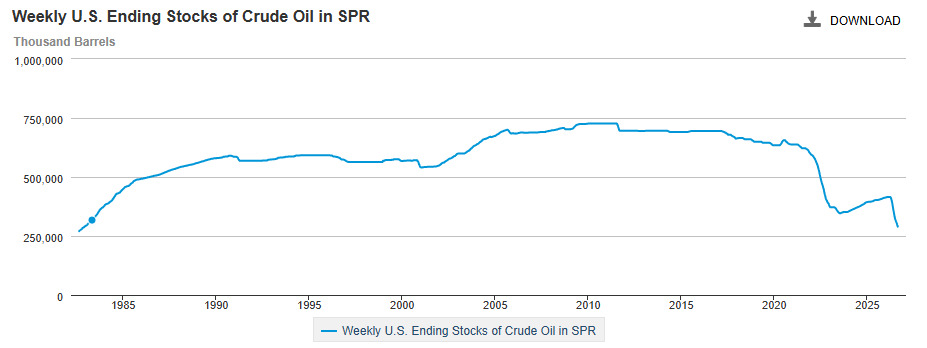
3. U.S. Strategic Petroleum Reserve (SPR) Inventory Levels The U.S. Strategic Petroleum Reserve is the ultimate bulwark against global supply shocks. When a geopolitical crisis erupts, if the U.S. has ample capacity to release crude from the SPR, it can temporarily extinguish a spike in oil prices. However, if reserve levels are hovering below historical averages, one must recognize that the market is in a highly vulnerable state where even minor supply chain disruptions can trigger widespread panic.
🔍 Case Study: In 2022, the U.S. executed the largest SPR drawdown in history in a bid to tame unprecedented inflation. As a result, the reserves, which once stood at nearly 700 million barrels, plummeted to the 300 million barrel range—the lowest level since the 1980s. This implies that should an extreme “black swan” event occur, such as a full-scale Iran-Israel war or a blockade of the Strait of Hormuz, the U.S. government will have drastically insufficient “ammunition” to intervene in the market and suppress a price explosion.
💡 Editor’s Note When analyzing international affairs, it is crucial to track the ‘data’ spoken by prices and logistics rather than getting bogged down by the narrative of the news. Routinely monitoring the three indicators above will serve as your own powerful edge in reading the macroeconomic landscape.
This article was conceptualized and rigorously fact-checked by the author. Google AI tools were utilized to assist in generating the visual assets and structuring the initial draft, ensuring a highly polished reading experience.